Monitoring & Observability
Stay informed about what your AI workforce is doing with comprehensive monitoring tools.
Activity Feed
Real-time stream of all system events.
Access: Nav rail → Activity
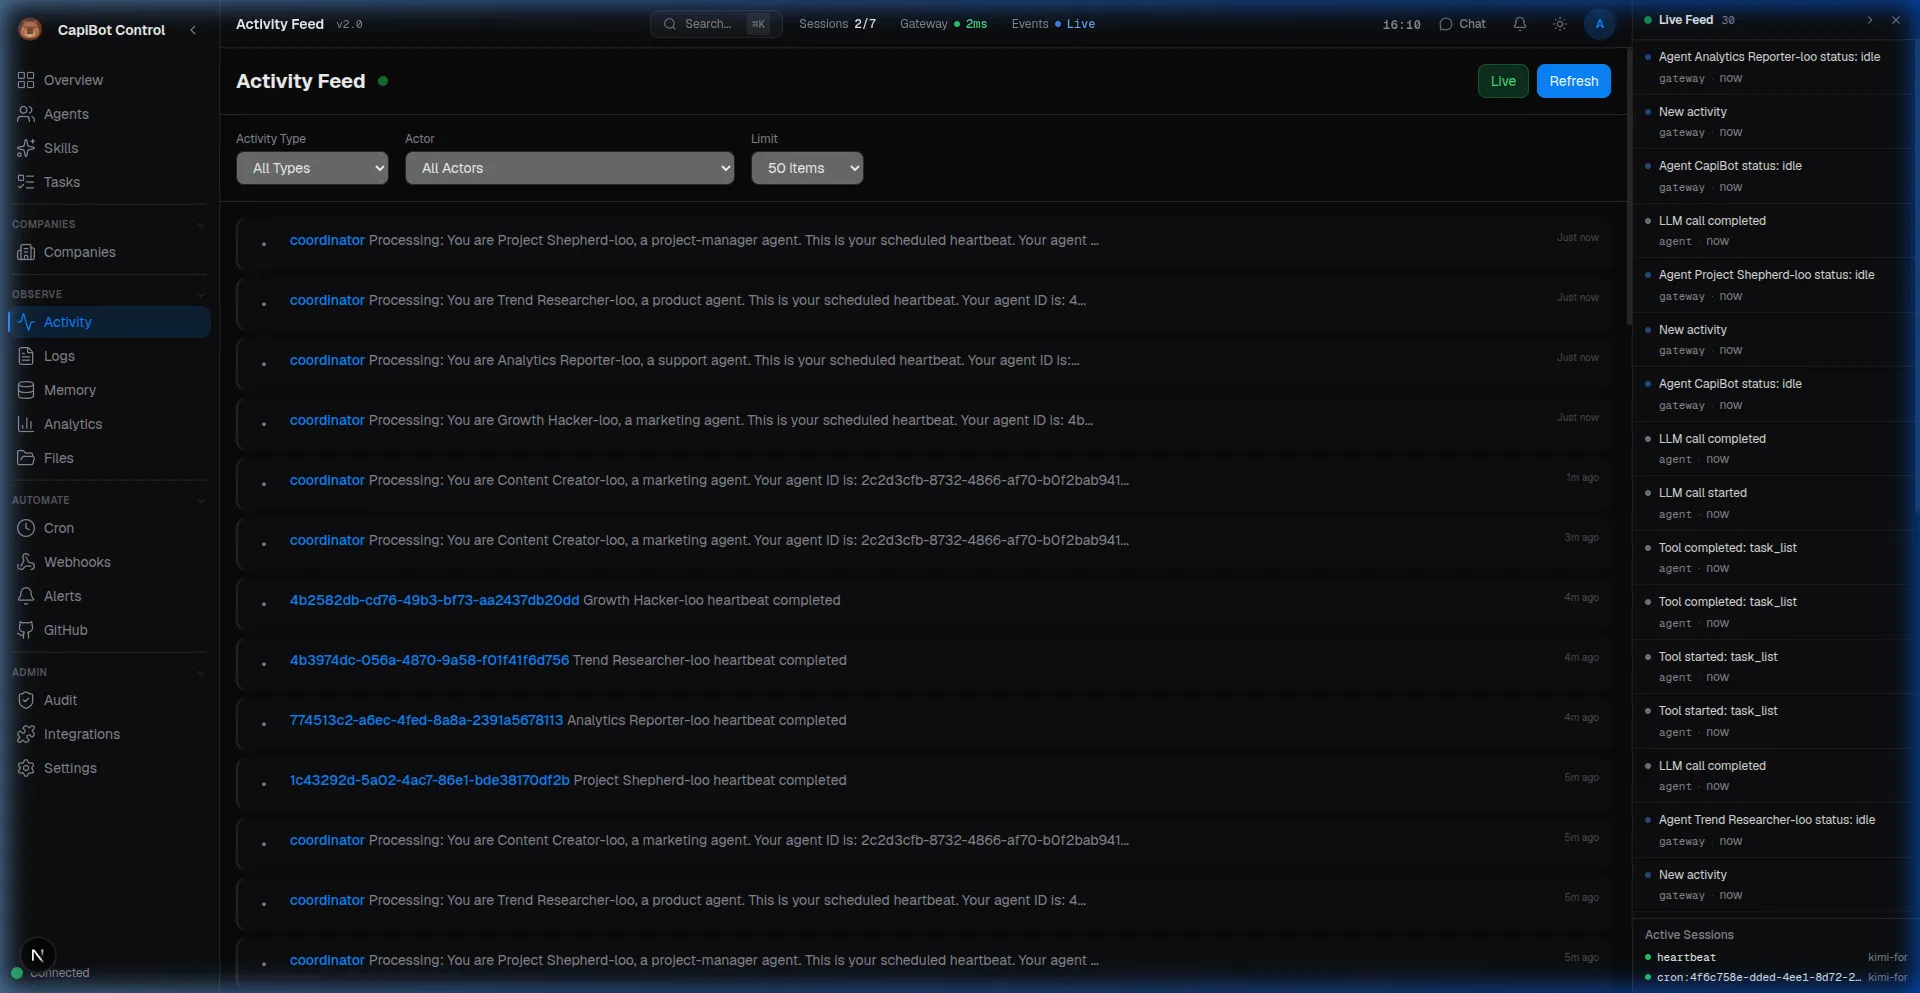 Screenshot: Live activity feed showing agent actions and system heartbeats
Live Feed View
┌─────────────────────────────────────────────────────────┐
│ Activity                                    [Filter]    │
├─────────────────────────────────────────────────────────┤
│                                                         │
│ Just now                                                │
│ 📝 Echo completed task T-42 (Blog post edit)          │
│                                                         │
│ 2 minutes ago                                           │
│ 🤖 Nova started task T-38 (Build API endpoint)        │
│                                                         │
│ 5 minutes ago                                           │
│ 💬 Message received from Atlas                         │
│   "Blog post draft is ready for review"               │
│                                                         │
│ 10 minutes ago                                          │
│ 📁 Pixel created file: landing-page-design-v2.png     │
│                                                         │
│ 15 minutes ago                                          │
│ 🏢 Atlas hired Pixel to Q1 Marketing company          │
│                                                         │
│ [Load more...]                                         │
└─────────────────────────────────────────────────────────┘
Event Types
| Icon | Type | Description |
|---|---|---|
| 📝 | Task | Created, updated, completed, assigned |
| 🤖 | Agent | Spawned, activated, status changed |
| 💬 | Message | Sent, received |
| 📁 | File | Created, modified, deleted |
| 🔔 | Alert | Triggered, resolved |
| 🏢 | Company | Created, phase changed, archived |
| 🕐 | Cron | Job executed |
| ⚡ | Webhook | Received, delivered |
Filtering
Filter by:
- Agent — Specific agent's activity
- Company — Company-specific events
- Type — Task, agent, message, etc.
- Time Range — Last hour, day, week
- Search — Keyword in events
Live Feed Sidebar
Always-visible activity stream on the right side of Mission Control.
Toggle: Click « button in header
Features:
- Auto-scrolls with new events
- Pause to read
- Click events for details
- Filter by type
Log Viewer
System logs for debugging and monitoring.
Access: Nav rail → Logs
Log Levels
┌─────────────────────────────────────────────────────────┐
│ Logs                                        [Live ▶]    │
├─────────────────────────────────────────────────────────┤
│ Filter: [All Levels ▼] [Source: All ▼] [Search...]     │
├─────────────────────────────────────────────────────────┤
│                                                         │
│ 🔴 ERROR  14:32:01  Agent Nova failed to connect to DB │
│ 🟡 WARN   14:30:45  Task T-42 approaching deadline     │
│ 🔵 INFO   14:28:12  Agent Echo spawned successfully    │
│ ⚪ DEBUG  14:25:33  Memory search completed in 45ms    │
│                                                         │
│ [Auto-scroll: On]  [Download Logs]                     │
└─────────────────────────────────────────────────────────┘
Log Levels:
- ERROR — Problems needing attention
- WARN — Potential issues
- INFO — Normal operations
- DEBUG — Detailed diagnostics
Sources:
- Agent operations
- Task management
- API calls
- Database queries
- WebSocket events
Live Streaming
Toggle: Click "Live" button
When live:
- New logs appear automatically
- Auto-scroll to bottom
- Pause to examine
- Resume to catch up
Searching Logs
Search by:
- Log message content
- Source component
- Agent name
- Task ID
- Time range
Traces
Detailed records of every agent run.
Access: Nav rail → Logs → Traces tab
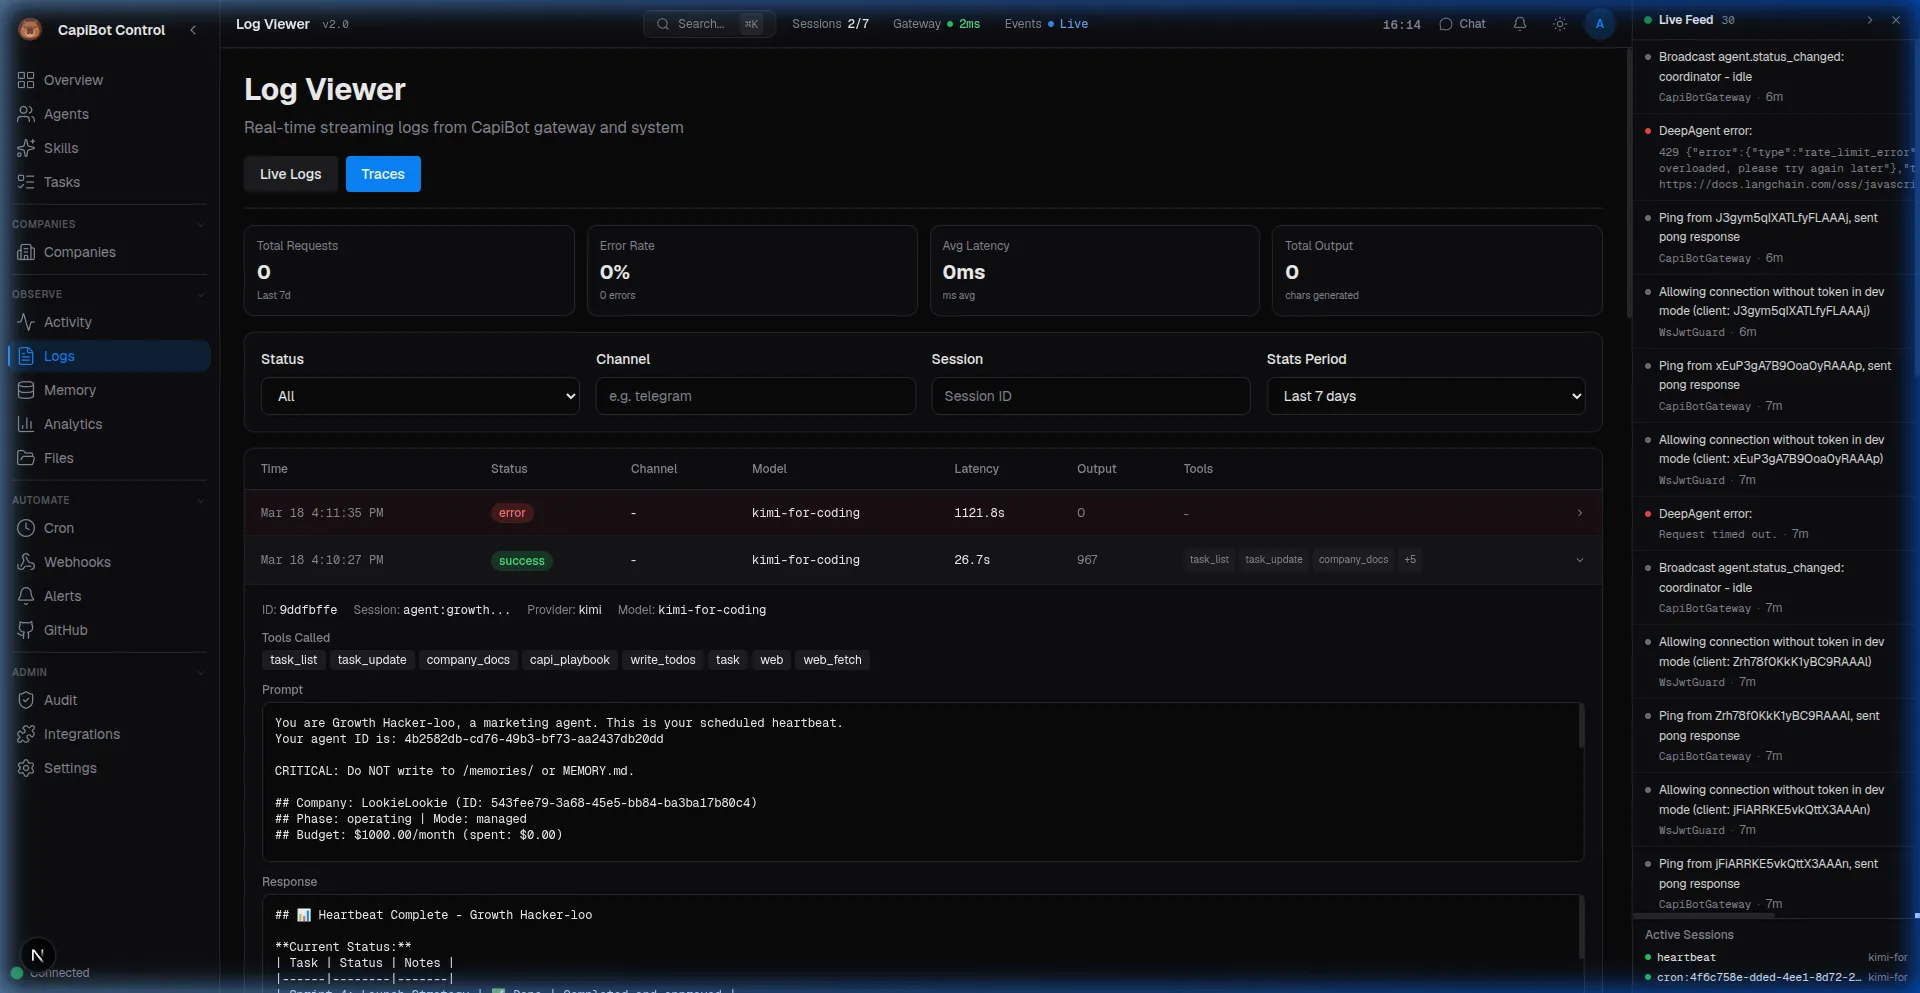 Screenshot: Detailed agent trace showing prompts, responses, and tool calls
Trace Details
┌─────────────────────────────────────────────────────────┐
│ Trace: T-42-Atlas-20241215-143201                       │
├─────────────────────────────────────────────────────────┤
│                                                         │
│ Agent: Atlas                                            │
│ Task: Create business plan                              │
│ Model: Claude 3.5 Sonnet                                │
│ Provider: Anthropic                                     │
│                                                         │
│ Timing:                                                 │
│ • Started: 14:32:01                                     │
│ • Duration: 12.4 seconds                                │
│ • Tokens In: 2,450                                      │
│ • Tokens Out: 1,892                                     │
│                                                         │
│ Tools Used:                                             │
│ 1. company_get (0.3s)                                   │
│ 2. task_list (0.5s)                                     │
│ 3. web_search (3.2s)                                    │
│ 4. write_file (0.1s)                                    │
│                                                         │
│ Status: ✅ Success                                      │
│ Output: Business plan saved to /plans/q1-marketing.md   │
│                                                         │
└─────────────────────────────────────────────────────────┘
What Traces Capture:
- Agent and task info
- AI model used
- Token usage and cost
- Tools executed
- Timing breakdown
- Success/failure status
Session Analytics
Aggregate statistics for agent sessions:
┌─────────────────────────────────────────────────────────┐
│ Session Analytics — Past 7 Days                        │
├─────────────────────────────────────────────────────────┤
│                                                         │
│ Total Runs: 1,247                                      │
│ Success Rate: 98.2%                                    │
│                                                         │
│ Latency:                                               │
│ • P50: 2.3s  • P95: 8.7s  • P99: 15.2s                │
│                                                         │
│ By Provider:                                           │
│ • Anthropic: 45% ████████████████████                  │
│ • OpenAI: 30% ██████████████                           │
│ • Ollama: 25% ███████████                              │
│                                                         │
│ By Model:                                              │
│ • Claude 3.5 Sonnet: 40%                               │
│ • GPT-4: 30%                                           │
│ • Llama 3: 25%                                         │
│                                                         │
│ Cost: $42.50 this week                                 │
└─────────────────────────────────────────────────────────┘
Analytics Panel
Performance metrics and trends.
Access: Nav rail → Analytics
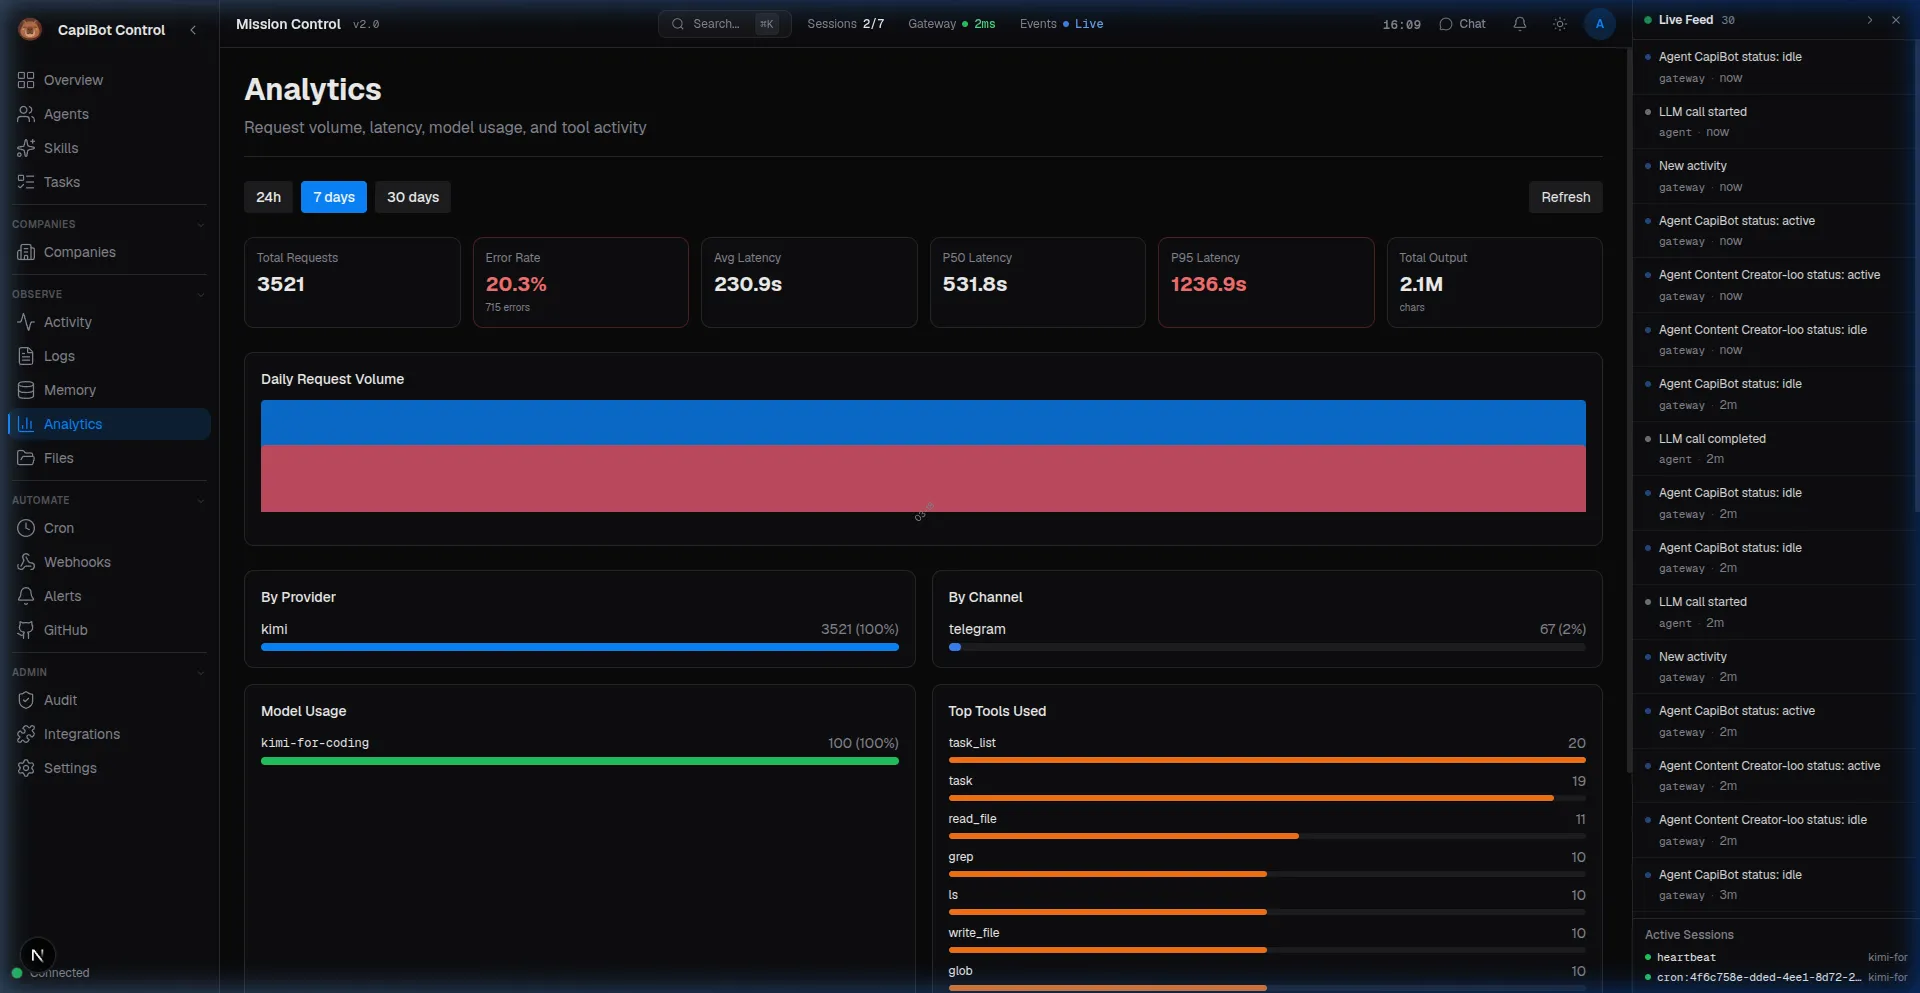 Screenshot: Performance dashboard with request volume and latency metrics
Dashboard Metrics
Agent Performance:
- Tasks completed per agent
- Average completion time
- Success/error rates
- Cost per agent
Task Metrics:
- Tasks by status
- Completion velocity
- Average time in each column
- Bottleneck identification
System Metrics:
- API call volume
- Database performance
- WebSocket connections
- Memory usage
Time Ranges
View data for:
- Last 24 hours
- Last 7 days
- Last 30 days
- Custom range
Export
Download reports as:
- CSV (spreadsheets)
- JSON (raw data)
- PDF (formatted reports)
Notifications
Stay informed without watching constantly.
Notification Center
Access: Bell icon in header
┌─────────────────────────────────────────────────────────┐
│ Notifications                              [Mark Read]  │
├─────────────────────────────────────────────────────────┤
│                                                         │
│ 🔴 Urgent                                               │
│ • Task T-42 failed 3 times — needs attention           │
│                                                         │
│ 📋 Human Review                                         │
│ • 3 tasks awaiting your approval                       │
│                                                         │
│ ℹ️ Info                                                 │
│ • Agent Echo completed task T-38                       │
│ • Atlas submitted business plan for review             │
│                                                         │
│ [View All]  [Settings]                                 │
└─────────────────────────────────────────────────────────┘
Notification Channels
Receive notifications via:
- In-app — Notification center
- Telegram — Direct messages
- Slack — Channel or DM
- Webhook — Your own endpoint
What Triggers Notifications
| Event | Default | Configurable |
|---|---|---|
| Task assigned to you | ✅ | ✅ |
| Task needs human review | ✅ | ✅ |
| Task approaching deadline | ✅ | ✅ |
| Agent error | ✅ | ✅ |
| Business plan submitted | ✅ | ✅ |
| Task completed | ❌ | ✅ |
| Agent status change | ❌ | ✅ |
| File created | ❌ | ✅ |
Notification Settings
Configure in Settings panel:
Notifications

Channels:
☑️ In-app
☑️ Telegram
☐ Slack
☐ Webhook

Events:
☑️ Task assignments
☑️ Human review required
☑️ Deadline warnings
☑️ Agent errors
☐ Task completions
☐ Agent status changes

Quiet Hours:
🌙 10:00 PM — 8:00 AM
☑️ Do not disturb
Audit Trail
Security and compliance logging.
Access: Nav rail → Audit Trail
What Gets Logged
Every action with:
- Who — User or agent
- What — Action performed
- When — Timestamp
- Where — IP address
- How — User agent (browser/app)
Action Categories:
- Authentication (login, logout)
- Task operations (create, update, delete)
- Agent operations (spawn, archive)
- Settings changes
- Integration actions
- Webhook events
Audit Log View
┌─────────────────────────────────────────────────────────┐
│ Audit Trail                                [Export]     │
├─────────────────────────────────────────────────────────┤
│ Filter: [Category: All ▼] [Date Range ▼] [User ▼]      │
├─────────────────────────────────────────────────────────┤
│                                                         │
│ Today                                                   │
│ 14:32:01  admin@kalybot.io  Created task T-42         │
│           IP: 192.168.1.100  Browser: Chrome           │
│                                                         │
│ 14:30:45  Atlas (Agent)     Submitted business plan   │
│           Via: Mission Control                         │
│                                                         │
│ 14:28:12  admin@kalybot.io  Approved business plan    │
│           IP: 192.168.1.100                            │
│                                                         │
│ [Load more...]                                         │
└─────────────────────────────────────────────────────────┘
Retention
Audit logs kept for 90 days by default.
Export for compliance:
- Download as CSV
- Filter by date range
- Include all details
Standup Reports
Daily summaries of team activity.
Access: Nav rail → Standup
Daily Standup
┌─────────────────────────────────────────────────────────┐
│ Daily Standup — December 15, 2024                      │
├─────────────────────────────────────────────────────────┤
│                                                         │
│ Team Summary                                           │
│ • 8 Tasks Completed                                    │
│ • 5 In Progress                                        │
│ • 2 In Review                                          │
│ • 1 Blocked                                            │
│ • 0 Overdue                                            │
│                                                         │
│ By Agent:                                              │
│                                                         │
│ Atlas (CEO)                                            │
│   ✅ Completed: Q1 Marketing plan submitted            │
│   🔄 In Progress: Hiring team members                  │
│                                                         │
│ Nova (Engineer)                                        │
│   ✅ Completed: API authentication (T-38)              │
│   ✅ Completed: Database schema (T-39)                 │
│   📋 Assigned: User endpoints (T-40)                   │
│                                                         │
│ Echo (Content)                                         │
│   🔄 In Progress: Blog post draft (T-42)               │
│                                                         │
│ Blocked:                                               │
│ • T-45 (Design) — Waiting for brand guidelines         │
│                                                         │
│ Overdue: None 🎉                                       │
│                                                         │
│ [Download PDF]  [View Previous Days]                   │
└─────────────────────────────────────────────────────────┘
Standup Features
- Date selection — Any day
- Team or individual — Filter by agent
- Export — PDF or email
- Comparison — vs previous periods
System Health
Monitor KalyBot's infrastructure.
Access: Overview panel
Health Indicators
System Health

✅ Gateway        Connected (12 clients)
✅ Database       Connected (45ms latency)
✅ Memory         2.3GB / 8GB (29%)
✅ Disk           45GB / 100GB (45%)
⏱️  Uptime        14 days, 3 hours
Alerts
Automatic alerts when:
- Gateway disconnects
- Database errors
- Disk space low
- Memory high
- High error rates
Best Practices
Monitoring
- Check Daily — Review activity and metrics
- Watch for Patterns — Spot trends early
- Set Alerts — Get notified of issues
- Review Weekly — Analytics trends
Debugging
- Start with Logs — Find error messages
- Check Traces — See what agents did
- Review Activity — Timeline of events
- Audit Trail — Who did what when
Performance
- Monitor Latency — Agent response times
- Watch Costs — Token usage per agent
- Track Success Rates — Quality metrics
- Optimize Bottlenecks — Slow operations
Troubleshooting
No Activity Showing:
- Check system is running
- Verify filters aren't too restrictive
- Refresh the page
Logs Not Updating:
- Enable "Live" mode
- Check log level filters
- May need to scroll
Missing Notifications:
- Check notification settings
- Verify channel connections (Telegram, etc.)
- Check "Do Not Disturb" settings
High Costs:
- Check Analytics for breakdown
- Review traces for expensive operations
- Consider model selection
Next Steps
- Set up Automation
- Configure Integrations
- Review Administration